|
|
|||
|
|
|||
|
The following paragraphs will give you a brief walk-through of an approach you can use to determine energy uniformity within your tank. |
|
Part 1 - Taking the Readings |
|
|
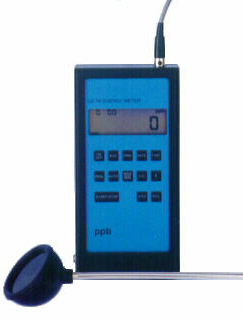
Although it is capable of performing quite complex tasks, analysis and calculations, the pb-500 Ultrasonic Cavitation Meter is very easy to use. This short example will introduce you to the meter and show you how to map a tank for energy density and uniformity over 10 distributed points at four levels of depth, giving a detailed confirmation of the performance of the ultrasonic systems. It includes the information you will need to enable you to transfer your data into a Microsoft (tm) Excel (tm) spreadsheet easily. All that is required to start the process is to plug the probe connector into the socket located at the top of the meter housing, and to press the On button to start up the meter. The whole tank-mapping process will take about 30 minutes from start to finish. |
|
We are going to take 40 readings in this sample tank, which consist of readings at 4 different depths at 10 locations across the surface of the liquid. The first thing to do is to determine the strategy of location. In this case estimation will be used as the basis of the 10 areal locations (See map opposite). The depth will be measured by marking graduations on the probe column, either using a spirit based felt pen or by attaching tape to the probe itself. Do bear in mind if you are doing this on a 'live' system any possible contamination hazards from adhesives or solvents. In this particular instance the probe stem will be marked with graduations from the centre of the sensor element at depths of 90, 180, 270 and 360 millimetres. |
|
|
We are going to use the automatic storage features of the meter to capture the data in sequential memory locations using a 10 second sample time. In order to avoid confusion, it is best to make sure the memory is clear, and this should be done by pressing The STO and RCL keys simultaneously. Now press Auto to set the meter into the mode which automatically stores each reading in the next available memory location. If it is not already functioning, start the ultrasonic system running, and allow it to reach an equilibrium state, or a state which represents its working conditions. Starting at the lowest depth (the highest marker on the stem), place the probe at position 1, and press the START/STOP button. You will see the large display reading the system power, and at the left the small digits counting up the elapsed time of this sample. When the time reaches 10 seconds, press the START/STOP button again. The counter will stop, and you will see a message briefly displayed which confirms that the value has been stored in Location 1 (Loc 1). Now move the probe to position 2, keeping the depth marker on the probe stem aligned with the water surface. Press the START/STOP button again to start the next sample, wait 10 seconds then press START/STOP again to store the sample in Loc 2. Simple, isn't it ! |
|
Repeat this process, taking 10 second readings at all of the sample positions in the tank at the same depth. When you have done this, return the probe to sample position 1 and take readings at the next depth marker, repeating samples at this depth for all 10 positions. Then go back and do 10 positions at the next depth and then the last 10 positions at the most shallow marker on the probe stem. You now have your data: 40 samples, taken in 10 positions at 4 different depths. We are now going to show you how to connect your ppb meter to your PC with the lead supplied and how to download these readings and transfer them to a file which may be read using Excel (tm). |
|
Part 2 - Transferring the Readings |
|
|
If you have not used the ppb communications program before, the installation is easy. All the files are included in the subdirectory 'ppbcom'. Put the floppy disk including this program in your a: drive and view it in Windows Explorer. Drag the entire folder (not the individual files) across to your Program Files directory. This will copy the directory and all its files. You can create a shortcut to the transfer program on your desktop or in your Start Menu in the normal way. Just Browse to Program Files - ppbcom - ppbcom.exe to find the executable program |
|
|
Use the lead supplied to attach your ppb meter to a chosen serial port on your computer. If COM1 is available, use that as it is the default for the transfer program. Start up ppbcom from your new shortcut or by double-clicking on ppbcom.exe in Windows Explorer. If you had to use a different serial port, then use the menu pick Setup - Serial Port to choose a different port, as shown in the dialog box on the right. Don't change any other settings, they are correct for the Ultrasonic Cavitation Meter's communication format. When you have the communications program installed and running with the correct serial port, all you have to do to read the data in to the PC is to press the PRN button on the meter. You will then see the information appear in the ppbcom screen, complete with titles and column headers. |
|
| The ppbcom program does not support a direct file save, so you need to start up Windows Notepad in your usual way. Select all the data in the ppbcom window, copy it to the clipboard (Ctrl + C) and then paste it into the Notepad file. Save the Notepad file with a suitable name (the .txt extension is fine), and close the file. Your data is now saved, and ppbcom can also be closed. The image below shows the transfer to Notepad |
|
| Now start Excel and open the file. You will have to set the dialog box to look for text files in order to see the file you have saved with its .txt extension. The format of the file is a fixed width field data file, and Excel will be able to determine this automatically upon opening. |
|
| Now click on the chart wizard to start creating your graph. The example shows a vertical bar graph being created. Follow the steps through the chart wizard and choose readings 1 to 10 for the series 1 bar stack. This will give you 10 vertical bars of the same colour representing the first set of depth readings. Name this series according to the depth of your tank for these readings. Repeat the process for readings 11 to 20, 21 to 30 and 31 to 40. |
|
| Make titles for your graph, add details to the vertical and horizontal scales, and then insert your graph into Excel as a new sheet. This makes it much easier to read and clearer when it is printed out. You should end up with something which looks similar to the graph below. This is taken from a real tank using the ppb meter, and shows good uniformity throughout. Each cluster of four bars shows the readings at different depths at the same sample point, and across the graph, the same colours represent the same depths at different sample points. |
|
|
With a little practice, assuming you have already installed ppbcom, you can perform such a tank analysis in about 30 minutes from start to finish, including taking all the readings and creating the graphs. It is possible to make analyses of tanks under differing conditions and import the data into the same spreadsheet to evaluate the effects of different parameters on your system. Click on the link at right to download an Excel file which is based on real data, showing the effects of flow, frequency and modulation on a tank under evaluation. This will give you an opportunity to look round the spreadsheet and see exactly how the data is formatted. Print Tip : If you would like to print out this page for reference when using your meter, or evaluating the product's suitability for your application, we suggest you set your browser page setup to landscape in order to print the graphic screens clearly. Alternatively, download a Word printable version from the document link to the right. We hope you have found this to be informative. It is based on real experience with the ppb pb-500 Ultrasonic Cavitation Meter. Please send any feedback by email using the contact link below. |
|
|

